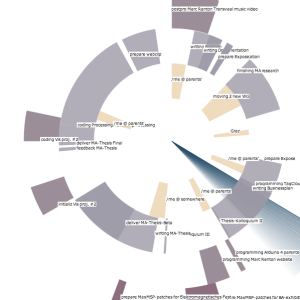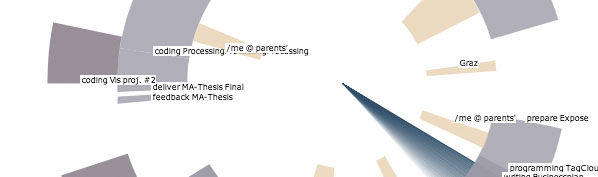
Sketch displays different categories as a Sunburst Diagram, while 12 months are equal to 360°.
This is an approach using a Sunburst Diagram instead of a regular project-plan for better visualizing of future tasks, that one will be confronted in the next 12 months.
Radar-style timeline displays current date.
Project + Sourcecode is featured on OpenProcessing.org.
Pros: Higher workloads are represented using darker color
Cons: Only 12 Months are mapped (could be changed eg. to st. like “project lifecycle”), current visualization works only for one person, not as flexible as a regular project-plan
Data in Dates.csv is saved in the format
[category],yyyy-mm-dd,yyyy-mm-dd,[topic]
eg: 2,2011-04-29,2011-05-11,programming TagCloudTool